Charts & Signals

Automatic channels and rails stay visible beside the price action, with the signal class and percentage distance close at hand. Signals surface across the whole list, each attached to its chart.
- Breakout
- Support
- Breakdown
- Rejection
NSE · NYSE · NASDAQ
A chart-first market-analysis workspace for NSE and US stocks. Open a chart and the channel, the signal and the distance to the channel line are already drawn — with the watchlist beside it, so one stock’s breakout is read against its list and sector, not in isolation.
We are inviting the first 10–20 people to test the daily workflow with us. No newsletters, no alerts, one email when your access is ready.
We use your email only to send beta invitations and launch notices — no payment details are asked for. Until the form service is connected, the button opens your own email app with the message addressed to support@chartinmotion.com; when it is, Formspree receives the address on our behalf and you get one confirmation email first. Withdraw any time by emailing support@chartinmotion.com or using the unsubscribe link in any email we send. How we handle your email · Grievance Officer.
Free at launch · Two curated lists · About 1,600 NSE and US stocks
One connected workflow
Read the chart, keep watchlist context in view, then move outward to sector and breadth without rebuilding your working set.
Automatic channels and rails stay visible beside the price action, with the signal class and percentage distance close at hand. Signals surface across the whole list, each attached to its chart.
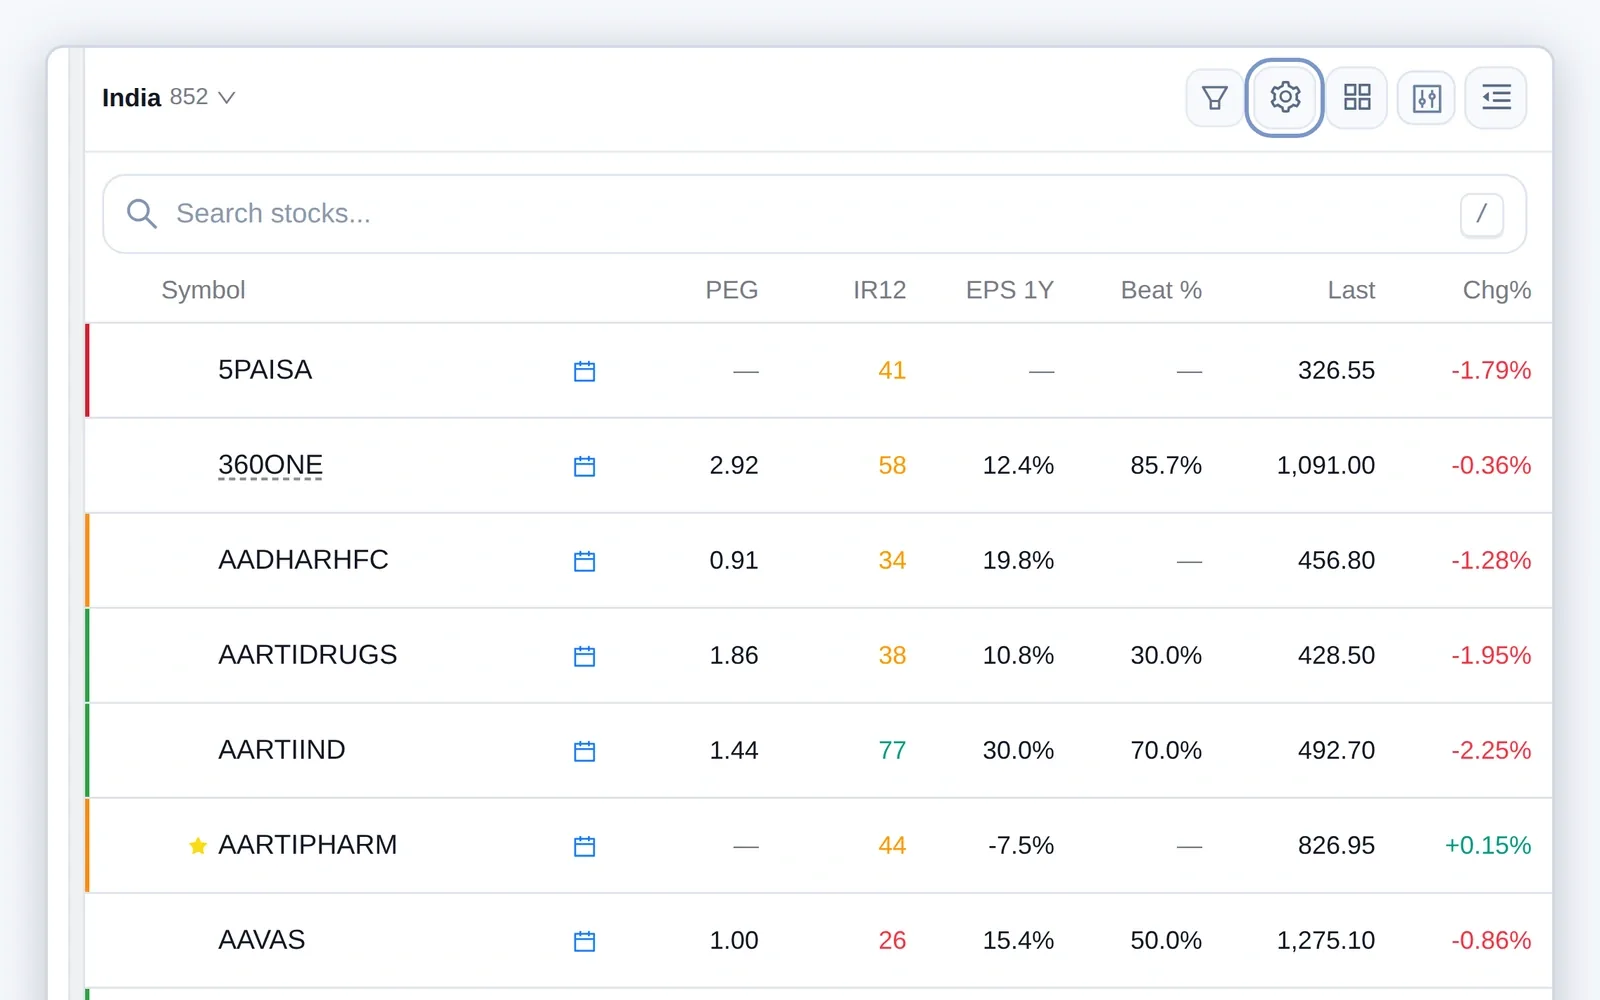
Scan Chg%, PEG, Score (0–10), IR3 and IR12 (3- and 12-month risk-adjusted strength ranks), and Revenue and EBITDA trend percentiles, alongside Starred, NEW, earnings and signal state.
A stock can look strong on its own chart while its sector weakens underneath it. Check whether a move has sector strength and wider market participation behind it.
Chart-first by design
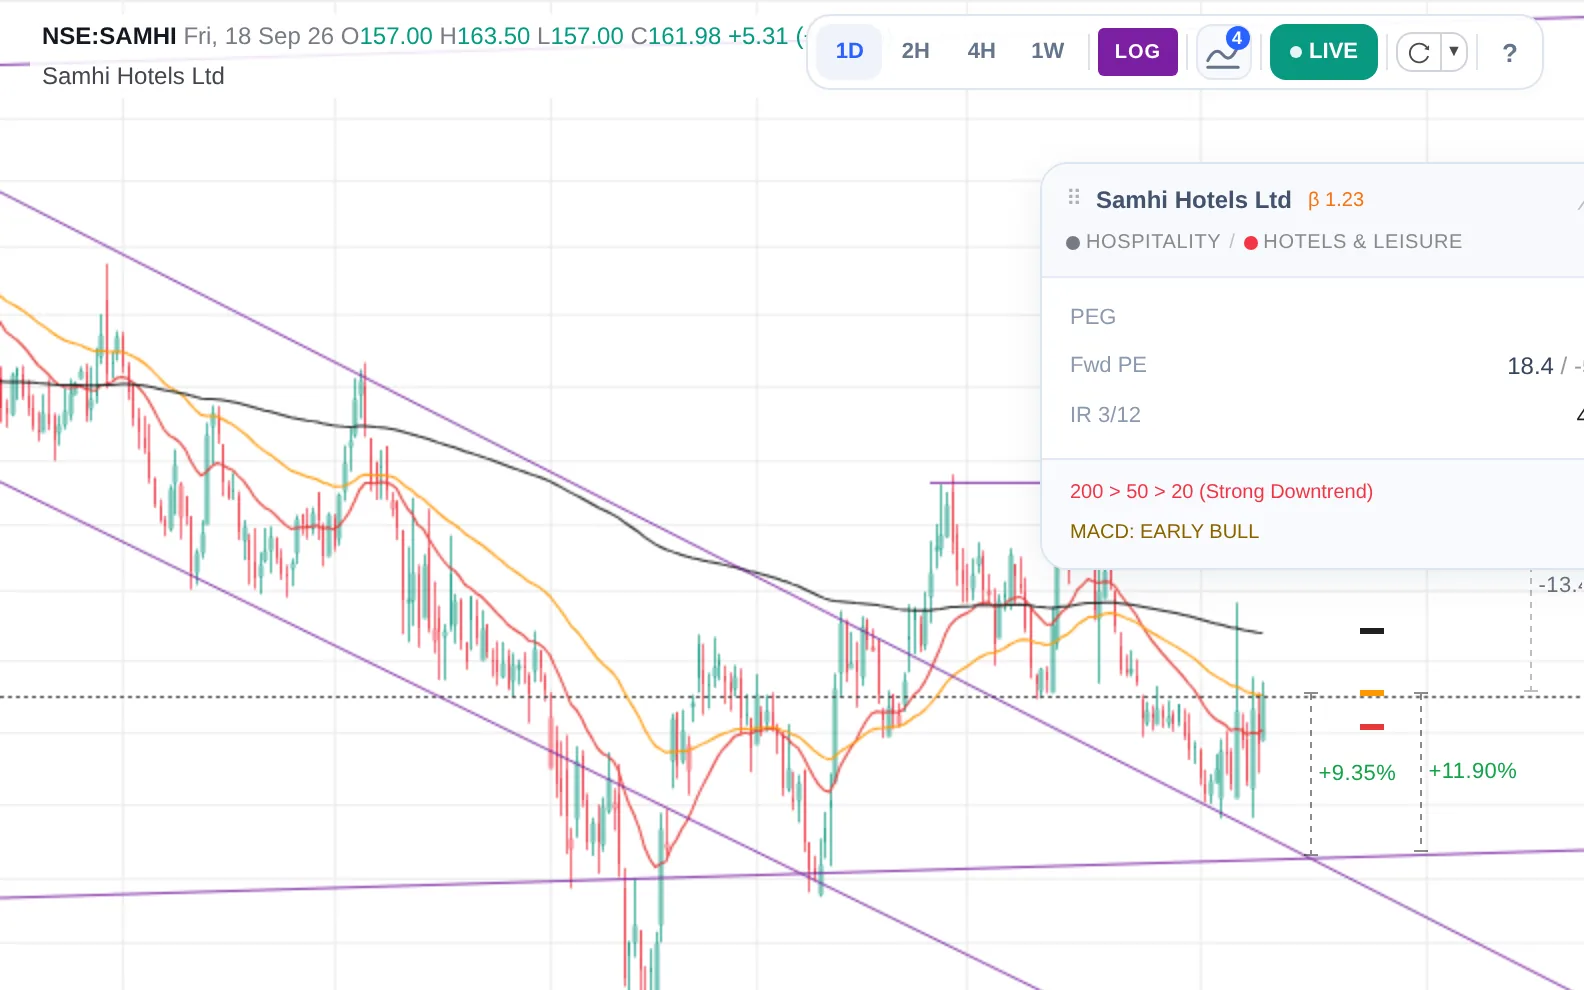
A chip without context is easy to misread. Chart in Motion keeps the channel, rail, signal class, and distance on the same chart.
Dense when it matters
The right sidebar is not a symbol picker. It is a compact scan surface that keeps signal, fundamental, recency, and earnings state together.
Structured earnings work
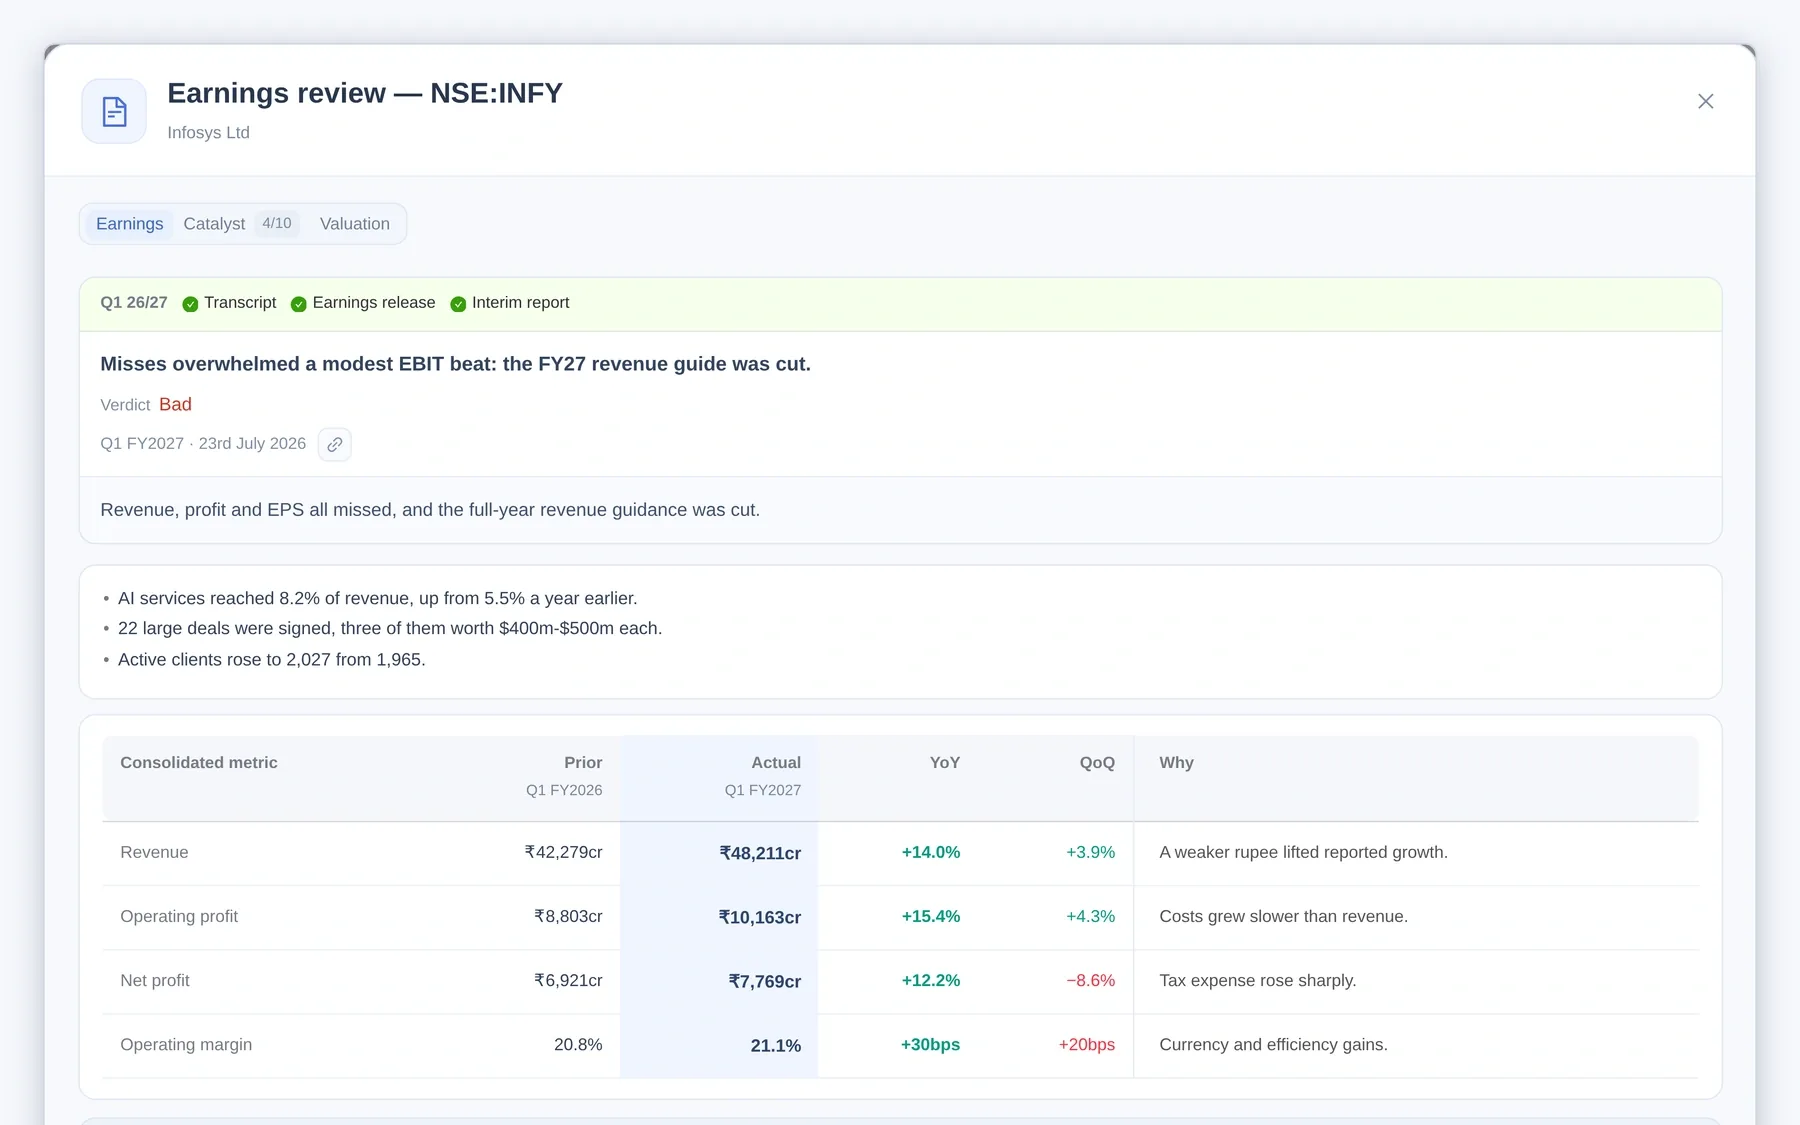
The Earnings panel organises document coverage, verdict, guidance, and key numbers. Simple / Full and Fast / Full views help you choose the right depth. Reading saved reports is part of the beta; generating fresh analysis arrives with the Research tier.
AI-generated analysis — verify before acting.
Join the early-access list. Invitations go out in small groups.Open the app and start with the guide.
First 10–20 invitations go out in small batches.